
LLDebugTool 是一款供开发者和测试人员使用的调试工具,可以帮助您在不使用 XCode 的情况下分析和操作数据。
LLDebugToolSwift 是 LLDebugTool 的扩展,它为 LLDebugTool 提供了 Swift 接口,LLDebugToolSwift 将与 LLDebugTool 同时发布。
如果你的项目是 Objective-C 项目,你可以使用 LLDebugTool,如果你的项目是 Swift 项目或包含 Swift 文件,你可以使用 LLDebugToolSwift。
为您的下一个项目选择 LLDebugTool,或将现有项目迁移过来——您会乐在其中的!🎊🎊🎊
- 对
cocoadocs.org的过多访问导致cocoadocs.org禁止对LLDebugTool的访问,因此此功能已被移除。
-
无需在 XCode 中运行,即可始终检查网络请求或查看某些事件的日志信息。这对于解决测试人员的 problemas 非常有用。
-
更容易过滤和筛选有用的信息。
-
更容易分析偶发问题。
-
更容易分析崩溃的原因。
-
更方便地分享、预览或删除沙盒文件,这在开发阶段非常有用。
-
更方便地观察应用的内存、CPU、FPS 等信息。
-
捕获屏幕截图、标记和分享。
-
更直观地查看视图结构和动态修改属性。
-
更准确地确定应用中的 UI 元素和颜色。
-
更容易访问和比较点信息。
-
更容易访问元素边框和框架。
-
快速输入 html。
-
随时模拟位置。
CocoaPods 是将 LLDebugTool 添加到您的项目的推荐方式。
- 将 LLDebugTool 的 Pod 条目添加到您的 Podfile 中
pod 'LLDebugTool' , '~> 1.0'。- 如果您只想在 Debug 模式下使用它,将 LLDebugTool 的 Pod 条目添加到您的 Podfile 中
pod 'LLDebugTool' , '~> 1.0' ,:configurations => ['Debug'],详细信息也请参见 Wiki/Use in Debug environment。如果您想指定版本,请使用pod 'LLDebugTool' , '1.3.8.1' ,:configurations => ['Debug']。- 建议的方法是使用多个目标,并且只将
pod 'LLDebugTool', '~> 1.0'添加到 Debug 目标。这样做的好处是不污染 Product 环境中的代码,并且可以在 Archive Debug 环境中将 App 集成进来(如果:configurations => ['Debug'],则它只能通过 XCode 运行。不能将其存档为一个应用)。- 通过运行
pod install来安装pod(s)。如果你找不到LLDebugTool或者找不到最新发布版本,请在pod install之前运行pod repo update。- 使用
#import "LLDebug.h"在任何需要LLDebugTool的地方包含它,或者你也可以在你的.pch文件中写入#import "LLDebug.h"。
- 在你的Podfile中为LLDebugToolSwift添加pod条目
pod 'LLDebugToolSwift' , '~> 1.0'。- 如果你只想在Debug模式下使用它,请将pod条目LLDebugToolSwift添加到Podfile中
pod 'LLDebugToolSwift' , '~> 1.0' ,:configurations => ['Debug'],详情也见Wiki/Use in Debug environment。如果你想指定版本,使用如下pod 'LLDebugToolSwift' , '1.3.8.1' ,:configurations => ['Debug']。- 推荐的做法是使用多个target,并且只将
pod 'LLDebugToolSwift', '~> 1.0'添加到Debug Target。这种方式有优点是不污染Product环境中的代码,并且可以集成到归档中的App的Debug环境中(如果:configurations => ['Debug'],则只能通过XCode运行。无法作为App归档)。- 必须在Podfile中添加
use_frameworks!。- 通过运行
pod install来安装pod(s)。如果你找不到LLDebugToolSwift或者找不到最新发布版本,请在pod install之前运行pod repo update。- 在任何需要LLDebugTool的地方使用
import LLDebugToolSwift包含它。
Carthage是一个去中心化的依赖管理器,它构建你的依赖并提供二进制框架。
要使用Carthage将LLDebugTool集成到你的Xcode项目中,请在你的
Cartfile中指定它
github "LLDebugTool"运行
carthage来构建框架并将生成的LLDebugTool.framework拖到你的Xcode项目中。
要使用Carthage将LLDebugToolSwift集成到你的Xcode项目中,请在你的
Cartfile中指定它
github "LLDebugToolSwift"运行
carthage来构建框架并将生成的LLDebugToolSwift.framework拖到你的Xcode项目中。
或者,你还可以直接将名为LLDebugTool的源文件夹添加到你的项目中。
- 下载最新代码版本latest code version或将存储库作为git子模块添加到你的git跟踪项目中。
- 在Xcode中打开你的项目,然后拖动名为
LLDebugTool的源文件夹。在你被提示“选择添加这些文件的方式”时,请务必勾选“需要时复制项目”。- 将Objective-C中的FMDB集成到你的项目中,FMDB是围绕SQLite的Objective-C包装。
- 将Objective-C中的Masonry集成到你的项目中,Masonry是一个Objective-C约束库。没有特定的版本要求,但建议使用最新版本。
- 使用
#import "LLDebug.h"在任何需要LLDebugTool的地方包含它,或者你也可以在你的.pch文件中写入#import "LLDebug.h"。
- 下载LLDebugTool最新代码版本LLDebugTool latest code version或将存储库作为git子模块添加到你的git跟踪项目中。
- 下载LLDebugToolSwift最新代码版本LLDebugToolSwift latest code version或将存储库作为git子模块添加到你的git跟踪项目中。
- 在Xcode中打开你的项目,然后拖动名为
LLDebugTool和LLDebugToolSwift的源文件夹。当你被提示“选择添加这些文件的方式”时,请务必勾选“需要时复制项目”。- 将Objective-C中的FMDB集成到你的项目中,FMDB是围绕SQLite的Objective-C包装。
- 将Objective-C中的Masonry集成到你的项目中,Masonry是一个Objective-C约束库。没有特定的版本要求,但建议使用最新版本。
- 在任何需要LLDebugTool的地方使用
import LLDebugToolSwift包含它。
你需要从"application:(UIApplication * )application didFinishLaunchingWithOptions:(NSDictionary * )launchOptions"开始LLDebugTool,否则你将丢失一些信息。
如果你想配置一些参数,必须在"startWorking"之前配置。更多的配置细节见LLConfig.h。
快速入门
Objective-C
#import "AppDelegate.h"
#import "LLDebug.h"

- (BOOL)application:(UIApplication *)application didFinishLaunchingWithOptions:(NSDictionary *)launchOptions {
    // The default color configuration is green background and white text color.

    // Start working.
    [[LLDebugTool sharedTool] startWorking];

    // Write your project code here.
    return YES;
}
Swift
import LLDebugToolSwift

    func application(_ application: UIApplication, didFinishLaunchingWithOptions launchOptions: [UIApplicationLaunchOptionsKey: Any]?) -> Bool {
        // ####################### Start LLDebugTool #######################//
        // Use this line to start working.
        LLDebugTool.shared().startWorking()

        // Write your project code here.

        return true
    }
以自定义配置开始
Objective-C
#import "AppDelegate.h"
#import "LLDebug.h"

- (BOOL)application:(UIApplication *)application didFinishLaunchingWithOptions:(NSDictionary *)launchOptions {

    // Start working with config.
    [[LLDebugTool sharedTool] startWorkingWithConfigBlock:^(LLConfig * _Nonnull config) {

        //####################### Color Style #######################//
        // Uncomment one of the following lines to change the color configuration.
        // config.colorStyle = LLConfigColorStyleSystem;
        // [config configBackgroundColor:[UIColor orangeColor] primaryColor:[UIColor whiteColor] statusBarStyle:UIStatusBarStyleDefault];

        //####################### User Identity #######################//
        // Use this line to tag user. More config please see "LLConfig.h".
        config.userIdentity = @"Miss L";

        //####################### Window Style #######################//
        // Uncomment one of the following lines to change the window style.
        // config.entryWindowStyle = LLConfigEntryWindowStyleNetBar;

    }];

    return YES;
}
Swift
import LLDebugToolSwift

    func application(_ application: UIApplication, didFinishLaunchingWithOptions launchOptions: [UIApplicationLaunchOptionsKey: Any]?) -> Bool {

        // Start working with config.
        LLDebugTool.shared().startWorking { (config) in
            //####################### Color Style #######################//
            // Uncomment one of the following lines to change the color configuration.
            // config.colorStyle = .system
            // config.configBackgroundColor(.orange, textColor: .white, statusBarStyle: .default)

            //####################### User Identity #######################//
            // Use this line to tag user. More config please see "LLConfig.h".
            config.userIdentity = "Miss L";

            //####################### Window Style #######################//
            // Uncomment one of the following lines to change the window style.
            // config.windowStyle = .netBar

            //####################### Features #######################//
            // Uncomment this line to change the available features.
            // config.availables = .noneAppInfo
        }

        return true
}无需进行任何操作,只需调用“startWorking”即可监视大部分网络请求,包括使用NSURLSession、NSURLConnection和AFNetworking。如果你发现某些情况下无法监视,请提交一个issue并告诉我。
打印和保存日志。更多信息请参阅 LLDebugToolMacros.h。
保存日志
Objective-C
#import "LLDebug.h"

- (void)testNormalLog {
    // Insert an LLog where you want to print.
    LLog(@"Message you want to save or print.");
}
Swift
import LLDebugToolSwift

    func testNormalLog() {
        // Insert an LLog where you want to print.
        LLog.log(message: "Message you want to save or print.")
    }
带有事件和级别的日志保存
Objective-C
#import "LLDebug.h"

- (void)testEventErrorLog {
    // Insert an LLog_Error_Event where you want to print an event and level log.
    LLog_Error_Event(@"The event that you want to mark. such as bugA, taskB or processC.",@"Message you want to save or print.");
}
Swift
import LLDebugToolSwift

    func testEventErrorLog() {
        // Insert an LLog_Error_Event where you want to print an event and level log.
        LLog.errorLog(message: "Message you want to save or print.", event: "The event that you want to mark. such as bugA, taskB or processC.")
}无需任何操作,只需调用“startWorking”即可拦截崩溃、存储崩溃信息、原因和堆栈信息,并在此时刻存储网络请求和日志信息。
LLDebugTool监视应用的CPU、内存和FPS。同时,您还可以快速查看应用的各种信息。
LLDebugTool提供了一个快速查看和管理沙盒的方法,您可以轻松删除沙盒内的文件/文件夹,也可以通过AirDrop将文件/文件夹分享到其他地方。只要Apple支持此文件格式,您就可以直接在LLDebugTool中预览文件。
LLDebugTool提供截图功能,允许进行简单的绘制和标记,便于在测试期间或UI设计师调试应用时记录。
LLDebugTool提供了一个非调试模式下查看或修改元素属性和信息的视图结构工具。
LLDebugTool提供了一个放大镜工具,用于放大本地区UI并查看指定像素的颜色值。
LLDebugTool提供了一个方便的工具来显示触摸点信息。
LLDebugTool提供了一个显示元素边框的功能,便于查看视图的框架。
LLDebugTool可以通过WKWebView、UIWebView或您在应用中自定义的ViewController在任意时刻调试HTML页面。
LLDebugTool提供了一个在任何时刻模拟位置的功能。
- 您可以通过查看Wiki获得更多帮助。
- 您可以通过下载并运行LLDebugToolDemo或LLDebugToolSwiftDemo来找到更多LLDebugTool的使用方法。该demo在MacOS 10.15.1、XCode 11.2.1、iOS 13.2.2、CocoaPods 1.8.4下构建。如果存在任何版本兼容问题,请让我知道。
LLDebugTool适用于iOS 8+,并需要ARC构建。它依赖于以下Apple框架,这些框架通常已包含在大多数Xcode模板中:
-
UIKit -
Foundation -
SystemConfiguration -
Photos -
QuickLook -
CoreTelephony -
CoreLocation -
MapKit -
AVKit
-
LLDebug.h公共头文件。您可以参考pch文件。
-
DebugToolLLDebugTool用于启动和停止LLDebugTool,您需要查看它。LLConfig用于自定义颜色、大小、标识等信息。如果您需要配置任何内容,请关注此文件。LLDebugToolMacros.h快速宏定义文件。 -
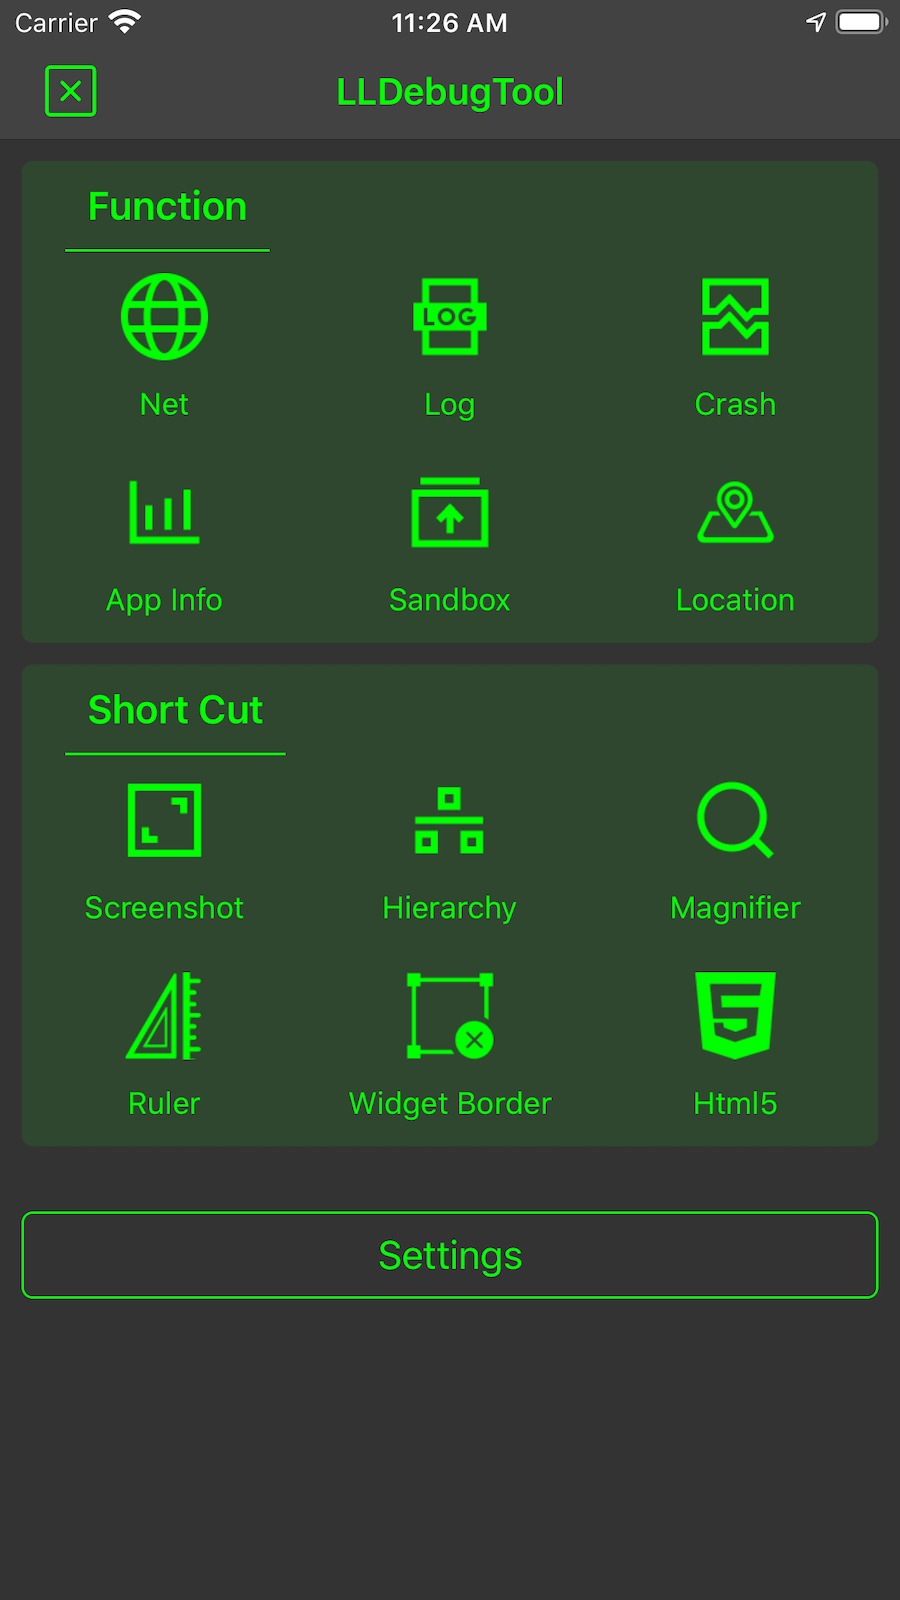
组件Network用于监视网络请求。Log用于快速打印和保存日志。Crash用于收集应用崩溃时的崩溃信息。AppInfo用于监视应用属性。Sandbox用于查看和操作沙盒文件。Screenshot用于处理和显示截图。Hierarchy用于处理和呈现视图结构。Magnifier用于放大镜功能。Ruler用于尺子功能。Widget Border用于小部件边框功能。Function用于显示函数。Html用于动态测试WebView。Location用于模拟位置。Setting用于动态设置配置。
- 如果您需要帮助,请提交一个issue。
- 如果您想提出一个{{特定的问题,请创建一个问题。}}
- 如果您{{找到一个错误并且可以提供可靠复现的步骤的话,请创建一个问题。}}
- 如果您{{有功能建议,请创建一个问题。}}
- 如果您{{发现任何问题或不满意的地方,请创建一个问题。}}
- 如果您{{有一些好建议或需求,请发送邮件至[email protected]给我。
- 如果您{{希望贡献,请提交一个Pull Request。}}
- 发送邮件至[email protected]
- 在Twitter 上发送信息@HdbLi
- 在简书上发送信息
每个LLDebugTool版本的简要总结可以在变更日志中找到。
本代码遵照MIT许可证的条款和条件进行分发。