YOChartImageKit 1.2.1
- 作者:
- Yasuharu Ozaki
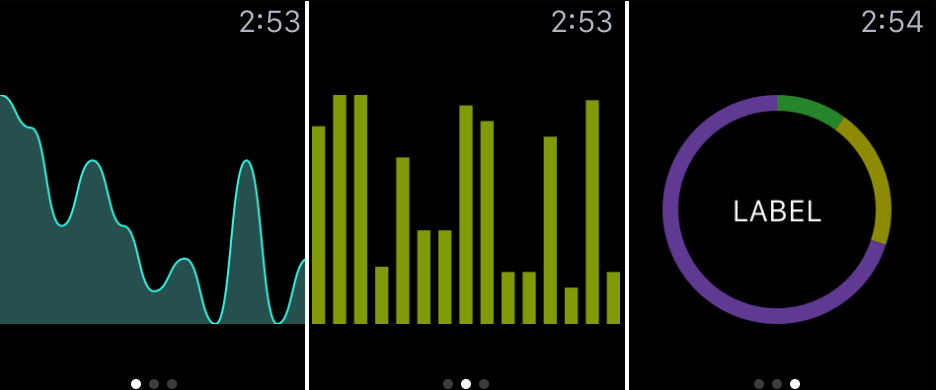
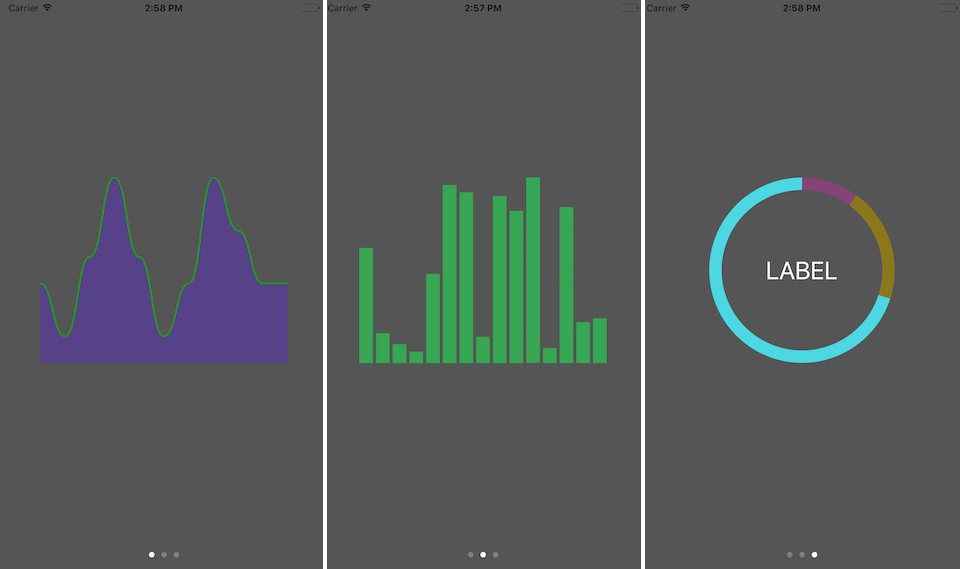
由于 watchOS 没有类 UIView,YOChartImageKit 会使用给定值绘制图表的 UIImage。
可以自定义值和颜色。
安装
CocoaSeeds
# For both iOS and watchOS framework
target 'YOChartImageKit' do
  github 'yasuoza/YOChartImageKit', '1.1.0', files: 'Source/YOChartImageKit/*.{h,m}'
end
配置
以下部分描述了绘制图表的方法。
如果您想尝试 YOChartImageKit,打开 YOChartImageKit.xcodeproj。iOS 和 watchOS 的示例应用程序可用。
折线图
实心
let image = YOLineChartImage()
image.strokeWidth = 4.0              // width of line
image.strokeColor = randomColor()    // color of line
image.values = [0.0, 1.0, 2.0]       // chart values
image.smooth = false                 // disable smooth line
image.drawImage(frame, scale: scale) // draw an image
平滑
let image = YOLineChartImage()
image.strokeWidth = 4.0              // width of line
image.fillColor = randomColor()      // color of area
image.values = [0.0, 1.0, 2.0]       // chart values
// image.smooth = true               // [default] draws a smooth line
image.drawImage(frame, scale: scale) // draw an image
条形图
垂直
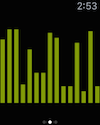
let image = YOBarChartImage()
image.values = [0.0, 1.0, 2.0]       // chart values
image.fillColor = randomColor()      // color of bars
// image.barPadding = 2.0            // [optional] padding of bars
// image.barStyle = .Vertical        // [default] draws a vertical bars
image.drawImage(frame, scale: scale) // draw an image
水平
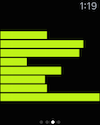
let image = YOBarChartImage()
image.values = [0.0, 1.0, 2.0]       // chart values
image.fillColor = randomColor()      // color of bars
// image.barPadding = 2.0            // [optional] padding of bars
image.barStyle = .Horizontal         // draws a horizontal bars
image.drawImage(frame, scale: scale) // draw an image
饼图
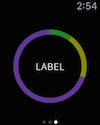
let image = YODonutChartImage()
image.donutWidth = 16.0                           // width of donut
// image.labelText = "LABEL"                      // [optional] center label text
// image.labelColor = UIColor.whiteColor()        // [optional] center label color
image.values = [10.0, 20.0, 70.0]                 // chart values
image.colors = (0..<3).map { _ in randomColor() } // colors of pieces
image.drawImage(frame, scale: scale)              // draw an image
框架要求
- watchOS ~> 2.0
构建要求
- Xcode >= 7.1
示例应用程序
对于 iOS 和 watchOS 都提供了示例应用程序。
pod try YOChartImageKit
或者用 Xcode 打开 YOChartImageKit.xcodeproj 并构建演示应用程序。