VBPieChart 1.2.1
- 由
- Volodymyr Boichentsov
- sakrist
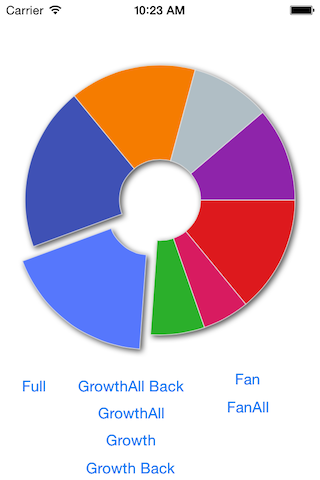
基于 CALayer 的 iOS 应用动画饼图控件,使用简单且具有自定义标签。
使用方法
使用 VBPieChart 创建简单的饼图
VBPieChart *chart = [[VBPieChart alloc] initWithFrame:CGRectMake(10, 50, 300, 300)];
[self.view addSubview:chart];

// Setup some options:
[chart setEnableStrokeColor:YES];
[chart setHoleRadiusPrecent:0.3]; /* hole inside of chart */

// Prepare your data
NSArray *chartValues = @[
 @{@"name":@"Apples", @"value":@50, @"color":[UIColor redColor]},
 @{@"name":@"Pears", @"value":@20, @"color":[UIColor blueColor]},
 @{@"name":@"Oranges", @"value":@40, @"color":[UIColor orangeColor]},
 @{@"name":@"Bananas", @"value":@70, @"color":[UIColor purpleColor]}
];

// Present pie chart with animation
[chart setChartValues:chartValues animation:YES duration:0.4 options:VBPieChartAnimationFan];
chartValues 需要定义为字典数组。
必须包含具有键 value 的饼图部分的值。
可选
namecolorlabelColoraccentstrokeColor
从 JSON 创建图表
VBPieChart *chart = [[VBPieChart alloc] initWithFrame:CGRectMake(10, 50, 300, 300)];
chart.startAngle = M_PI+M_PI_2;
chart.holeRadiusPrecent = 0.5;
[self.view addSubview:chart];
NSString *json_example = @"[ {\"name\":\"first\", \"value\":\"50\", \"color\":\"#84C69B\", \"strokeColor\":\"#fff\"}, \
{\"name\":\"second\", \"value\":\"60\", \"color\":\"#FECEA8\", \"strokeColor\":\"#fff\"}, \
{\"name\":\"second\", \"value\":\"75\", \"color\":\"#F7EEBB\", \"strokeColor\":\"#fff\"}, \
{\"name\":\"second\", \"value\":\"90\", \"color\":\"#D7C1E0\", \"strokeColor\":\"#fff\"} ]";

NSData *data = [json_example dataUsingEncoding:NSUTF8StringEncoding];
NSArray *chartValues = [NSJSONSerialization JSONObjectWithData:data options:0 error:nil];

[chart setChartValues:chartValues animation:YES duration:0.5 options:VBPieChartAnimationFan];
自定义标签位置的图表
VBPieChart *chart = [[VBPieChart alloc] initWithFrame:CGRectMake(10, 50, 300, 300)];
chart.startAngle = M_PI+M_PI_2;
chart.holeRadiusPrecent = 0.5;
[self.view addSubview:chart];
[chart setLabelsPosition:VBLabelsPositionCustom];
[chart setLabelBlock:^CGPoint( CALayer *layer, NSInteger index) {
    CGPoint p = CGPointMake(sin(-index/10.0*M_PI)*50+50, index*30);
    return p;
}];

[chart setChartValues:@[
                         @{@"name":@"37%", @"value":@65, @"color":@"#5677fcaa", @"labelColor":@"#000"},
                         @{@"name":@"13%", @"value":@23, @"color":@"#2baf2baa", @"labelColor":@"#000"},
                         @{@"name":@"19.3%", @"value":@34, @"color":@"#b0bec5aa", @"labelColor":@"#000"},
                         @{@"name":@"30.7%", @"value":@54, @"color":@"#f57c00aa", @"labelColor":@"#000"}
                         ]
             animation:YES];
基本文档
VBPieChart 是 UIView 的子类。
属性
length
圆饼长度。最小值是 0,最大值是 2*M_PI。
startAngle
饼图起始角度。(M_PI 将使起始在左侧)
holeRadiusPrecent
空洞半径为整个半径的百分比。值 0..1。(实际的空洞半径将通过 radius 计算得出)
radiusPrecent
定义 radius,完整半径 = frame.size.width/2,实际 radius = 完整半径 * radiusPrecent。值 0..1。
labelBlock
块将 help 重新定义标签位置。
方法
获取所有更改的图表值。
- (NSArray *) chartValues;
简单的数据设置。
- (void) setChartValues:(NSArray *)chartValues;
设置凭据到饼图,具有或不具有动画,动画选项和持续时间。
- (void) setChartValues:(NSArray *)chartValues animation:(BOOL)animation duration:(float)duration options:(VBPieChartAnimationOptions)options;
动画选项
VBPieChartAnimationFanAllVBPieChartAnimationGrowthVBPieChartAnimationGrowthAllVBPieChartAnimationGrowthBackVBPieChartAnimationGrowthBackAllVBPieChartAnimationFanVBPieChartAnimationTimingEaseInOutVBPieChartAnimationTimingEaseInVBPieChartAnimationTimingEaseOutVBPieChartAnimationTimingLinear
更改索引处的元素值。值将通过动画进行更改。
- (void) setValue:(NSNumber*)value pieceAtIndex:(NSInteger)index;
在索引处插入新值。带有动画。 - (void) insertChartValue:(NSDictionary*)chartValue atIndex:(NSInteger)index;
删除索引处的值。
- (void) removePieceAtIndex:(NSInteger)index;
支持广告。
<script async src("//#/pagead/js/adsbygoogle.js")></script><script> (adsbygoogle = window.adsbygoogle || []).push({}); </script>