RHLinePlot
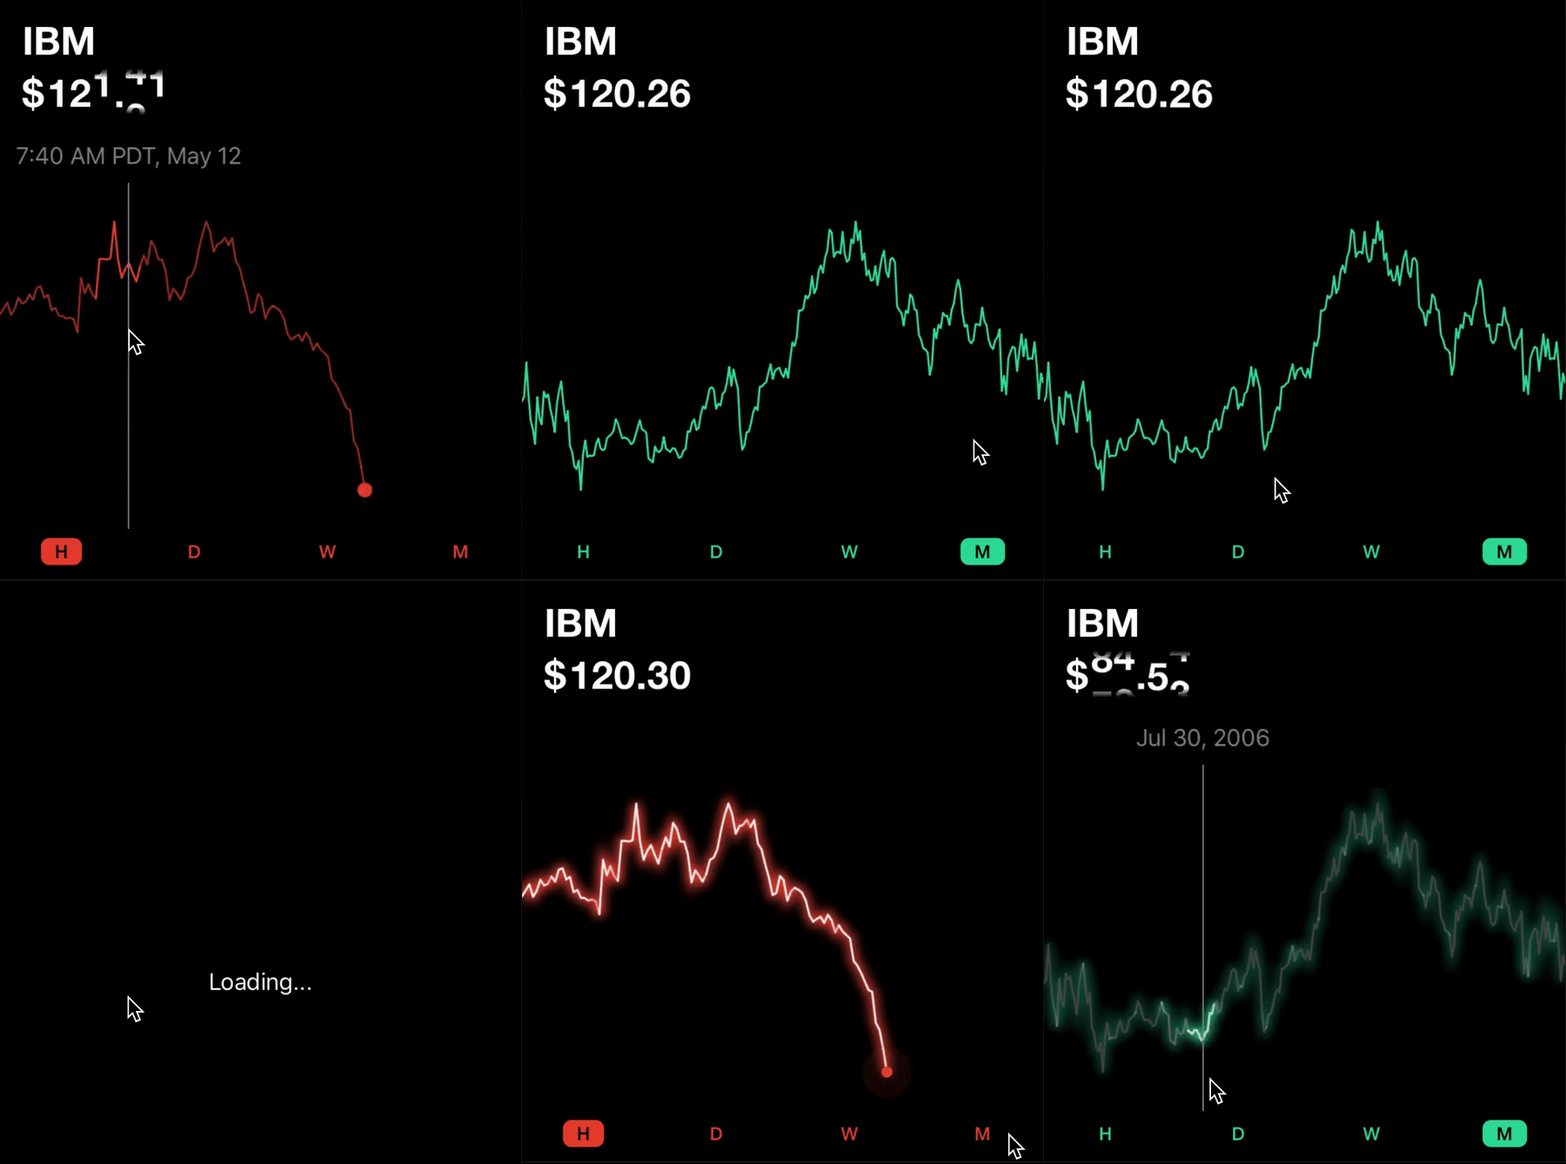
像 Robinhood 应用一样的线图,在 SwiftUI 中
寻找如何做 动态价格标签效果?请看这里的另一个仓库:aunnnn/MovingNumbersView
备注:当然,这与 Robinhood 正式官方没有任何关联。这只是尝试复制它的 UI,我并不拥有任何这些设计。
示例股票 API 来自 Alphavantage。
目录
功能✨
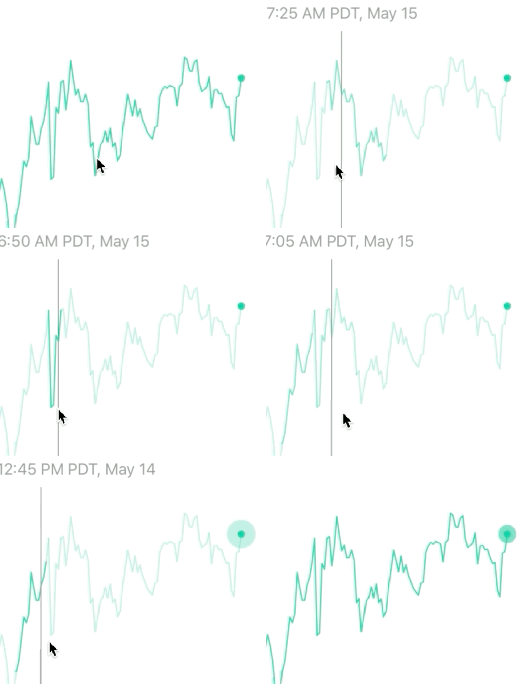
- 支持拖动交互,突出显示活动部分
- 支持发光指示器,即用于实时数据
- 自定义动画持续时间和发光大小、标签等
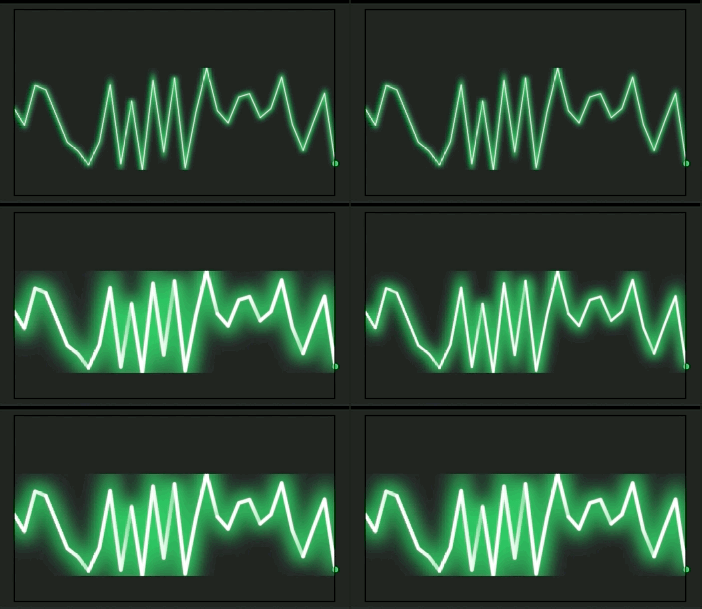
- 激光模式!
玩一玩示例应用以查看可能的定制和演示中展示的 Robinhood 风格视图。
安装
只需任意使用源代码。库位于 RHLinePlot 文件夹。
APIs
无交互
RHLinePlot(
    values: valuesToPlot,
    occupyingRelativeWidth: 0.8,
    showGlowingIndicator: true,
    lineSegmentStartingIndices: segments,
    activeSegment: 2,
    customLatestValueIndicator: {
      // Return a custom glowing indicator if you want
    }
)
注意
segments是各线段的起始索引。例如,values = [1,2,3,4,3,2,1,2,3,4]和segments = [0,4,8]表示线图中有三段:0-3,4-7,8-9。occupyingRelativeWidth = 0.8是为了绘制图表画布的 80%。这在模拟实时数据时很有用。例如,计算当天相对 24 小时时段的当前小时数并使用该比率。默认值是 1.0。
带有交互元素
RHInteractiveLinePlot(
    values: values,
    occupyingRelativeWidth: 0.8,
    showGlowingIndicator: true,
    lineSegmentStartingIndices: segments,
    didSelectValueAtIndex: { index in
      // Do sth useful with index...
},
    customLatestValueIndicator: {
      // Custom indicator...
},
    valueStickLabel: { value in
      // Label above the value stick...
})
通过环境配置
定制
YourView
.environment(\.rhLinePlotConfig, RHLinePlotConfig.default.custom(f: { (c) in
    c.useLaserLightLinePlotStyle = isLaserModeOn
}))
完整配置
public struct RHLinePlotConfig {

    /// Width of the rectangle holding the glowing indicator (i.e. not `radius`, but rather `glowingIndicatorWidth = 2*radius`). Default is `8.0`
    public var glowingIndicatorWidth: CGFloat = 8.0

    /// Line width of the line plot. Default is `1.5`
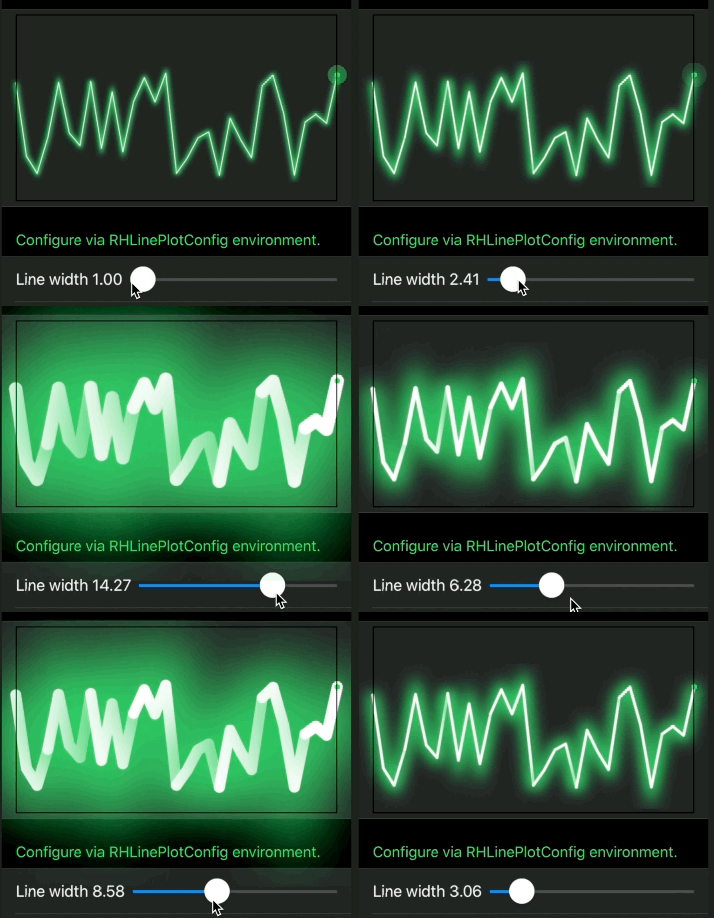
    public var plotLineWidth: CGFloat = 1.5

    /// If all values are equal, we will draw a straight line. Default is 0.5 which draws a line at the middle.
    public var relativeYForStraightLine: CGFloat = 0.5

    /// Opacity of unselected segment. Default is `0.3`.
    public var opacityOfUnselectedSegment: Double = 0.3

    /// Animation duration of opacity on select/unselect a segment. Default is `0.1`.
    public var segmentSelectionAnimationDuration: Double = 0.1

    /// Scale the fading background of glowing indicator to specified value. Default is `5` (scale to 5 times bigger before disappear)
    public var glowingIndicatorBackgroundScaleEffect: CGFloat = 5

    public var glowingIndicatorDelayBetweenGlow: Double = 0.5
    public var glowingIndicatorGlowAnimationDuration: Double = 0.8

    /// Use laser stroke mode to plot lines.
    ///
    /// Note that your plot will be automatically shrinked so that the blurry part fits inside the canvas.
    public var useLaserLightLinePlotStyle: Bool = false

    /// Use drawing group for laser light mode.
    ///
    /// This will increase responsiveness if there's a lot of segments.
    /// **But, the blurry parts will be clipped off the canvas bounds.**
//    public var useDrawingGroupForLaserLightLinePlotStyle: Bool = false

    /// The edges to fit the line strokes within canvas. This interacts with `plotLineWidth`. Default is `[]`.
    ///
    /// By default only the line skeletons (*paths*) exactly fits in the canvas,** without considering the `plotLineWidth`**.
    /// So when you increase the line width, the edge of the extreme values could go out of the canvas.
    /// You can provide a set of edges to consider to adjust to fit in canvas.
    public var adjustedEdgesToFitLineStrokeInCanvas: Edge.Set = []

    // MARK:- RHInteractiveLinePlot

    public var valueStickWidth: CGFloat = 1.2
    public var valueStickColor: Color = .gray

    /// Padding from the highest point of line plot to value stick. If `0`, the top of value stick will be at the same level of the highest point in plot.
    public var valueStickTopPadding: CGFloat = 28

    /// Padding from the lowest point of line plot to value stick. If `0`, the end of value stick will be at the same level of the lowest point in plot.
    public var valueStickBottomPadding: CGFloat = 28

    public var spaceBetweenValueStickAndStickLabel: CGFloat = 8

    /// Duration of long press before the value stick is activated and draggable.
    ///
    /// The more it is, the less likely the interactive part is activated accidentally on scroll view. Default is `0.1`.
    ///
    /// There's some lower-bound on this value that I guess coming from delaysContentTouches of
    /// the ScrollView. So if this is `0`, iit won't immediately activate the long press (but quickly horizontal pan will).
    public var minimumPressDurationToActivateInteraction: Double = 0.1

    public static let `default` = RHLinePlotConfig()

    public func custom(f: (inout RHLinePlotConfig) -> Void) -> RHLinePlotConfig {
        var new = self
        f(&new)
        return new
    }
}
待办事项
- 支持双指拖动以在同一图表上比较两个值。
在交互式图表中拖动会消耗所有的手势。如果您将其放入一个- 通过使用一个清晰的 代理视图来处理手势解决。ScrollView,您将无法在交互式图表区域内滚动滚动视图,您将与之交互的是图表。
有趣的解决方法
拖动手势消耗了所有的拖动
问题:因此您不能将图表放入滚动视图中并向下滚动图表。我尝试添加了像苹果教程中那样的
LongPressGesture,但看起来如果放在滚动视图中,它也会独占手势。
解决方案:目前通过放置一个实现自定义长按手势检测的 代理视图 来解决这个问题。
指示标签必须粘在图边缘
问题:为了将指示标签 (
valueStickLabel) 的平移保持在图的水平边缘,我们需要知道标签的宽度。但是其内容是动态的,可以是用户设置的任何内容。
解决方案:这可以通过有两个 valueStickLabel 来修复。第一个用于确定大小并隐藏起来。第二个使用 GeometryReader 涂层在第一个之上,这样我们就可以知道标签的最终大小,以便在下一次计算平移(我们可以在宽度中限定其偏移量)。
// Indicator Label
//
// HACK: Get a dynamic size of the indicator label with `overlay` + `GeometryReader`.
// Hide the bottom one (just use it for sizing), then show the overlaid one.
valueStickLabel.opacity(0)
    .overlay(
        GeometryReader { labelProxy in
            valueStickLabel
                .transformEffect(labelTranslation(labelProxy: labelProxy))
        }.opacity(stickAndLabelOpacity))
激光模式对段高亮无响应
问题:激光模式为线形图的每个段都放置了3个模糊效果,因此它可能在快速拖动周围时无响应,并且在动画不同部分的透明度时无响应。
解决方案:只需使用 drawingGroup()。这非常有帮助。然而,这也引入了下一个问题
使用 drawingGroup() 在图像区域边缘裁剪了模糊效果
问题:使用
drawingGroup()似乎在模糊部分应用了类似于clipsToBounds的效果,看起来不太好。
解决方案:相对于 plotLineWidth 配置(值越大,模糊块越大)调整绘图画布的内边距,以便 drawingGroup 有更多空间绘制和缓存图像
let adjustedEachBorderDueToBlur: CGFloat = {
    if rhLinePlotConfig.useLaserLightLinePlotStyle {
        return 7.5 * rhLinePlotConfig.plotLineWidth // Magic number accounts for blurring
    } else {
        return 0
    }
}()
let largerCanvas = canvasFrame.insetBy(dx: -adjustedEachBorderDueToBlur, dy: -adjustedEachBorderDueToBlur)


