MBXGraphs 0.3.4
- 作者:
- tamarabernad
- tamarinda
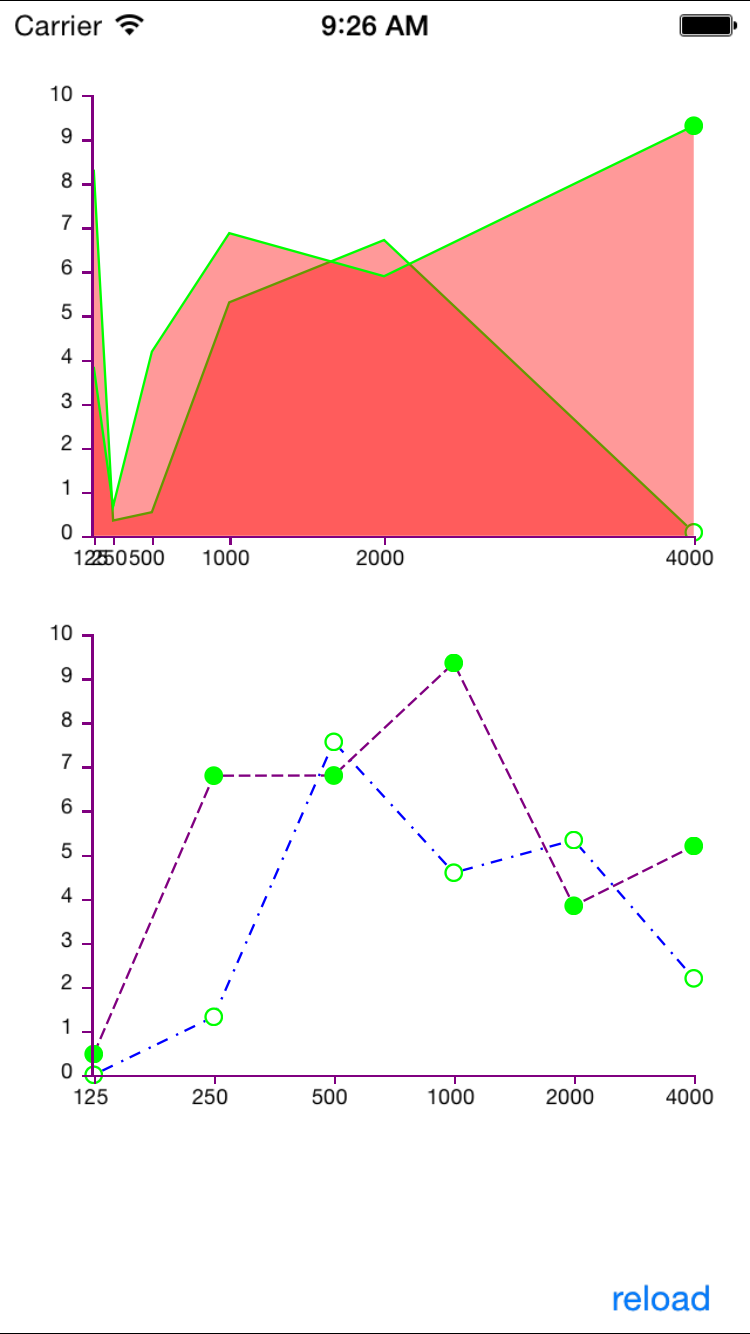
MBXGraphs是一个库,用于在图表中显示一个或多个折线图,具有多种显示选项(填充、无填充、虚线、端点标记等)。该库还负责XY轴,能够自定义它们并显示漂亮且分布均匀的间隔。
它可以与nib文件一起使用,也可以使用代码创建视图。
功能
轴上的分布类型可以选择,有两种选项
MBXLineGraphDataSourceAxisCalcValueDistribute根据从数据获取的值考虑轴值来分配轴值。
MBXLineGraphDataSourceAxisCalcEquallyDistribute在视图中均匀分配轴值,不考虑值。这对于对数分布的轴很好。
可以在轴上选择刻度标记的分布
MBXLineGraphDataSourceAxisCalcAutoTickmark自动计算最佳的“最佳”分布和显示在轴上的值。在开始和结束处留出一些空间以使图形看起来更好。这对于Y轴值很好。
MBXLineGraphDataSourceAxisCalcValueTickmark使用数据集中确切的值作为轴上的刻度标记和值。这对于X轴值很好。
用法
要运行示例项目,请克隆仓库,然后首先从Example目录运行pod install。
安装
代码示例
#import "MBXViewController.h"
#import "MBXLineGraphDataSource.h"
#import "MBXGraphView.h"
#import "MBXGraphAxisView.h"

#import "MBXChartVM.h"

@interface MBXViewController ()<MBXGraphDelegate, MBXGraphAxisDelegate>
@property (weak, nonatomic) IBOutlet MBXGraphView *viewGraph;
@property (weak, nonatomic) IBOutlet MBXGraphAxisView *viewYAxis;
@property (weak, nonatomic) IBOutlet MBXGraphAxisView *viewXAxis;

@property (nonatomic, strong) MBXLineGraphDataSource *dataSourceNib;
@property (nonatomic, strong) MBXLineGraphDataSource *dataSourceCode;


@property (nonatomic, strong) MBXGraphView *viewGraphCode;
@property (nonatomic, strong) MBXGraphAxisView *viewYAxisCode;
@property (nonatomic, strong) MBXGraphAxisView *viewXAxisCode;

@end

@implementation MBXViewController

////////////////////////////////////
#pragma mark - Actions
////////////////////////////////////
- (IBAction)onChangeValuesclick:(id)sender {
    [self setRandomValuesForAllDataSources];
    [self reload];
}
////////////////////////////////////
#pragma mark - Lazy getters
////////////////////////////////////
- (MBXGraphAxisView *)viewXAxisCode{
    if(!_viewXAxisCode){
        _viewXAxisCode = [MBXGraphAxisView new];
        [_viewXAxisCode setDirection:kDirectionHorizontal];
    }
    return _viewXAxisCode;
}
- (MBXGraphAxisView *)viewYAxisCode{
    if(!_viewYAxisCode){
        _viewYAxisCode = [MBXGraphAxisView new];
        [_viewYAxisCode setDirection:kDirectionVertical];
    }
    return _viewYAxisCode;
}
- (MBXGraphView *)viewGraphCode{
    if(!_viewGraphCode){
        _viewGraphCode = [MBXGraphView new];
    }
    return _viewGraphCode;
}
- (MBXLineGraphDataSource *)dataSourceNib{
    if(!_dataSourceNib){
        _dataSourceNib = [MBXLineGraphDataSource new];
    }
    return _dataSourceNib;
}
- (MBXLineGraphDataSource *)dataSourceCode{
    if(!_dataSourceCode){
        _dataSourceCode = [MBXLineGraphDataSource new];
    }
    return _dataSourceCode;
}

////////////////////////////////////
#pragma mark - Life cycle
////////////////////////////////////
- (void)viewDidLoad
{
    [super viewDidLoad];

    // nib created graph
    self.viewGraph.dataSource = self.dataSourceNib;
    self.viewYAxis.dataSource = self.dataSourceNib;
    self.viewXAxis.dataSource = self.dataSourceNib;

    self.viewXAxis.direction = kDirectionHorizontal;
    self.viewYAxis.direction = kDirectionVertical;

    self.viewGraph.delegate = self;
    self.viewXAxis.delegate = self;
    self.viewYAxis.delegate = self;

    // code created graph
    [self.view addSubview:self.viewGraphCode];
    [self.view addSubview:self.viewYAxisCode];
    [self.view addSubview:self.viewXAxisCode];

    self.viewYAxisCode.frame = CGRectMake(0, 270, 40, 188);
    self.viewXAxisCode.frame = CGRectMake(40, 458, 256, 40);
    self.viewGraphCode.frame = CGRectMake(40, 270, 256, 188);

    self.viewGraphCode.dataSource = self.dataSourceCode;
    self.viewYAxisCode.dataSource = self.dataSourceCode;
    self.viewXAxisCode.dataSource = self.dataSourceCode;

    self.viewGraphCode.delegate = self;
    self.viewYAxisCode.delegate = self;
    self.viewXAxisCode.delegate = self;

    self.dataSourceNib.xAxisCalc = MBXLineGraphDataSourceAxisCalcValueTickmark | MBXLineGraphDataSourceAxisCalcValueDistribute;
    self.dataSourceNib.yAxisCalc = MBXLineGraphDataSourceAxisCalcAutoTickmark | MBXLineGraphDataSourceAxisCalcValueDistribute;

    self.dataSourceCode.xAxisCalc = MBXLineGraphDataSourceAxisCalcValueTickmark | MBXLineGraphDataSourceAxisCalcEquallyDistribute;
    self.dataSourceCode.yAxisCalc = MBXLineGraphDataSourceAxisCalcAutoTickmark | MBXLineGraphDataSourceAxisCalcValueDistribute;

    [self setRandomValuesForAllDataSources];
}
- (void)viewDidAppear:(BOOL)animated{
    [self reload];

}
- (void)didRotateFromInterfaceOrientation:(UIInterfaceOrientation)fromInterfaceOrientation{
    [self reload];
}
////////////////////////////////////
#pragma mark - MBXLineGraphDelegate
////////////////////////////////////
- (void)MBXLineGraphView:(MBXGraphView *)graphView configureAppearanceGraphVM:(MBXGraphVM *)graphVM{

    if(graphView == self.viewGraph){
        graphVM.color = [UIColor greenColor];
        graphVM.drawingType =  MBXLineGraphDawingTypeLine | MBXLineGraphDawingTypeFill;
        graphVM.fillColor = [UIColor redColor];
        graphVM.fillOpacity = 0.4;
        graphVM.priority = 1000;
    }else{

        if([graphVM.uid isEqualToString:@"0"]){
            graphVM.color = [UIColor blueColor];
            graphVM.lineStyle = MBXLineStyleDotDash;
            graphVM.drawingType = MBXLineGraphDawingTypeLine | MBXLineGraphDawingAnimated;
        }else{
            graphVM.color = [UIColor purpleColor];
            graphVM.lineStyle = MBXLineStyleDashed;
            graphVM.drawingType = MBXLineGraphDawingTypeLine | MBXLineGraphDawingAnimated;
        }
        graphVM.priority = 1000;
        graphVM.animationDuration = 0.5f;
    }

}
- (CGSize)MBXLineGraphView:(MBXGraphView *)graphView markerSizeAtIndex:(NSInteger)index{
    return CGSizeMake(8, 8);
}
- (BOOL)MBXLineGraphView:(MBXGraphView *)graphView hasMarkerAtIndex:(NSInteger)index{
    if(self.viewGraph == graphView){
        return index == [self.dataSourceCode.chartVM getGraphByUid:@"0"].proportionPoints.count-1;
    }else{
        return YES;
    }
}
- (CALayer *)MBXLineGraphView:(MBXGraphView *)graphView markerViewForGraphVM:(MBXGraphVM *)graphVM ForPointAtIndex:(NSInteger)index{
    CALayer *marker = [CALayer layer];
    [marker setMasksToBounds:YES];
    if ([graphVM.uid isEqualToString:@"0"]) {
        [marker setBorderWidth:1.0];
        [marker setBackgroundColor:[UIColor whiteColor].CGColor];
        [marker setBorderColor:[UIColor greenColor].CGColor];
    }else{
        [marker setBackgroundColor:[UIColor greenColor].CGColor];
    }
    [marker setCornerRadius:8/2];
    return marker;
}

- (UIView *)MBXGraphAxis:(MBXGraphAxisView *)graphAxis ViewForValue:(NSNumber *)value{
    UILabel *label = [UILabel new];
    label.font =[UIFont systemFontOfSize:9];
    label.text = [value stringValue];
    [label sizeToFit];
    return label;
}
- (NSInteger)MBXGraphAxisTicksHeight:(MBXGraphAxisView *)graphAxis{
    return 1;
}
- (NSInteger)MBXGraphAxisTicksWidth:(MBXGraphAxisView *)graphAxis{
    return 4;
}
- (UIColor *)MBXGraphAxisColor:(MBXGraphAxisView *)graphAxis{
    return [UIColor purpleColor];
}

////////////////////////////////////
#pragma mark - helpers
////////////////////////////////////
- (void)reload{
    [self.viewGraph reload];
    [self.viewYAxis reload];
    [self.viewXAxis reload];

    [self.viewGraphCode reload];
    [self.viewYAxisCode reload];
    [self.viewXAxisCode reload];
}
- (void) setRandomValuesForAllDataSources{
    [self setRandomValuesForDataSource:self.dataSourceCode];
    [self setRandomValuesForDataSource:self.dataSourceNib];
}
- (void) setRandomValuesForDataSource:(MBXLineGraphDataSource *)dataSource{
    NSArray *graphValues = @[
                             @[@{@"y":[self rand], @"x": @125},
                               @{@"y":[self rand], @"x": @250},
                               @{@"y":[self rand], @"x": @500},
                               @{@"y":[self rand], @"x": @1000},
                               @{@"y":[self rand], @"x": @2000},
                               @{@"y":[self rand], @"x": @4000}],

                             @[@{@"y":[self rand], @"x": @125},
                               @{@"y":[self rand], @"x": @250},
                               @{@"y":[self rand], @"x": @500},
                               @{@"y":[self rand], @"x": @1000},
                               @{@"y":[self rand], @"x": @2000},
                               @{@"y":[self rand], @"x": @4000}]
                             ];
    [dataSource setMultipleGraphValues:graphValues];
}
- (NSNumber *) rand{
    int max = 10;
    return [NSNumber numberWithFloat:(((float)rand() / RAND_MAX) * max)];
}
@end
作者
Tamara Bernad,@tamarinda
许可证
MBXGraphs在MIT许可证下提供。有关更多信息,请参阅LICENSE文件。