JYGraphView 0.1.0
- 由
- John Yorke
29.03.15 - 更新以支持 Apple Watch!
我为类中添加了一个方法 (graphImage),可以返回一个图表的快照(作为 UIImage),这可以在 Apple Watch 上使用。你可能需要对字体大小和笔划宽度进行一些调整,但实验起来很有趣!请查看示例应用程序以获取示例。
典型用法
 JYGraphView *graph = [[JYGraphView alloc] initWithFrame:rect];
 graph.graphData = data;
 graph.strokeColor = [UIColor orangeColor];
 graph.hidePoints = YES;
 graph.hideLabels = YES;
 graph.barColor = [UIColor clearColor];
 [graph plotGraphData];
 [interfaceGroup setBackgroundImage:[graph graphImage]];
JYGraphView 是以简单、极简风格图形化数据的简便方法,并且可高度自定义。
简介
JYGraphView 是一个稍微修改过的图表版本,出现在 Tempo/Weather 中。JYGraphView 是 UIScrollView 的子类。
您可以使用以下代码快速将图表显示在屏幕上
JYGraphView *graphView = [[JYGraphView alloc] initWithFrame:frame];

// Set the data for the graph
graphView.graphData = @[@2,@4,@5,@7,@8,@10,@10,@10,@12,@10,@20,@21];

// Set the xAxis labels (optional)
graphView.graphXAxisLabels = @[@"Jan",@"Feb",@"Mar",@"Apr",@"May",@"Jun",@"Jul",@"Aug",@"Sep",@"Oct",@"Nov",@"Dec"];

[self.view addSubview:graphView];
或者,如果使用 xibs,可以将 UIView 放入您的 xib > Identity Inspector > 将类名更改为 JYGraphView。
如果没有设置任何颜色、字体等,则图表将以其默认样式显示(与 Tempo/Weather 相同)。
graphView 的默认内容宽度是框架宽度的两倍。您可以通过在调用之前设置 graphWidth 来设置自己的宽度,更窄或更宽的值。
注意 图表在 UIView 的 didMoveToSuperview 上绘制,但如果您需要手动刷新图表(如果有新的数据输入),您可以像这样使用 plotGraphData
graphView.graphData = newDataArray;

[graphView plotGraphData];
所需文件
将以下文件拖放到您的项目中
- JYGraphView.h
- JYGraphView.m
- JYGraphPoint.h
- JYGraphPoint.m
默认情况下,图表使用一个 UIView 子类(JYGraphPoint)来绘制每个点。
自定义
注意 我强烈建议您下载示例项目并在设备或模拟器上运行它,以玩转自定义选项(在 iPad 上看起来更好)。
如果您想稍微自定义图表的外观,您可以在显示图表之前使用任何 UIColor 设置 strokeColor 和 fillColor。
graphView.pointFillColor = [UIColor colorWithRed:0.21 green:0.00f blue:0.40 alpha:1.0];
graphView.strokeColor = [UIColor colorWithRed:0.53 green:0.00 blue:0.98 alpha:1.0];
您可以通过在调用 plotGraphData 之前设置以下选项来进一步自定义 graphView
backgroundColor,barColor,labelFont,labelFontColor,labelBackgroundColor,strokeWidth,hidePoints,useCurvedLine 和 hideLabels。
您可以选择隐藏线、点或标签,通过将它们的相应属性设置为 NO 来实现。
您可以选择使用 Catmull-Rom 弦线的曲线线,通过将 useCurvedLine 设置为 YES。默认值是 NO。
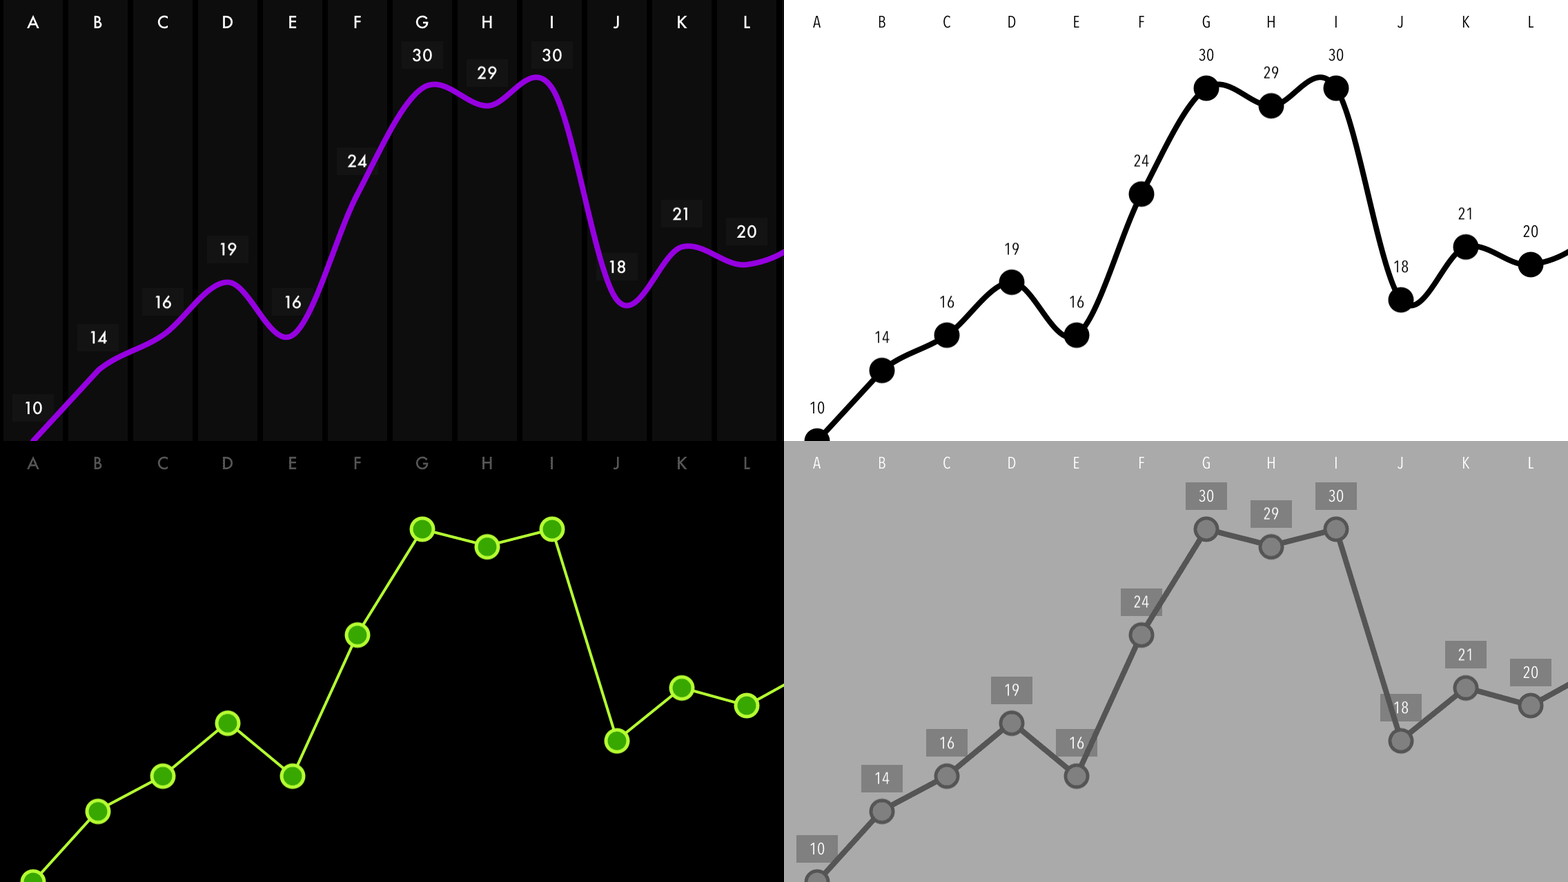
一个完全自定义的图表可能看起来像这样
// Customisation options
graphView.fillColor = [UIColor colorWithRed:0.94 green:0.32 blue:0.59 alpha:1.0];
graphView.strokeColor = [UIColor darkGrayColor];
graphView.useCurvedLine = YES;
graphView.graphWidth = 720;
graphView.backgroundColor = [UIColor grayColor];
graphView.barColor = [UIColor lightGrayColor];
graphView.labelFont = [UIFont fontWithName:@"AvenieNextCondensed-Regular" size:12];
graphView.labelFontColor = [UIColor whiteColor];
graphView.labelBackgroundColor = [UIColor grayColor];
一些自定义图表的例子
图表视图实际做什么
图表接受您的数字,计算出范围,将其转换为坐标,然后绘制元素
- 背景条(实际上是标签)
- 连接这些点的线条
- 每个点上的标签
- 最后,点本身
可能的用例
- 使用iPhone上的动态芯片来显示过去7/10/30天的步数计数据
- 将其链接到您的应用销售,并显示过去30天/12个月的趋势
- 将其用于天气应用中,以显示未来24小时/7天的预测温度
已知问题
- 没有测试。我知道。我是一个糟糕的程序员。
感谢
首先,如果有人在我的项目中使用了它并且告诉我,我会感到非常高兴。其次,如果有人获取了改进JYGraphView的方法,我也会同样高兴。
您可以给我发邮件([email protected])或在Twitter上联系我 @johnyorke
许可证
MIT许可证(包含在项目文件夹中)。换句话说……随便用吧!


