HCLineChartView 1.0.2
- 作者
- Hypercubesoft
![]()
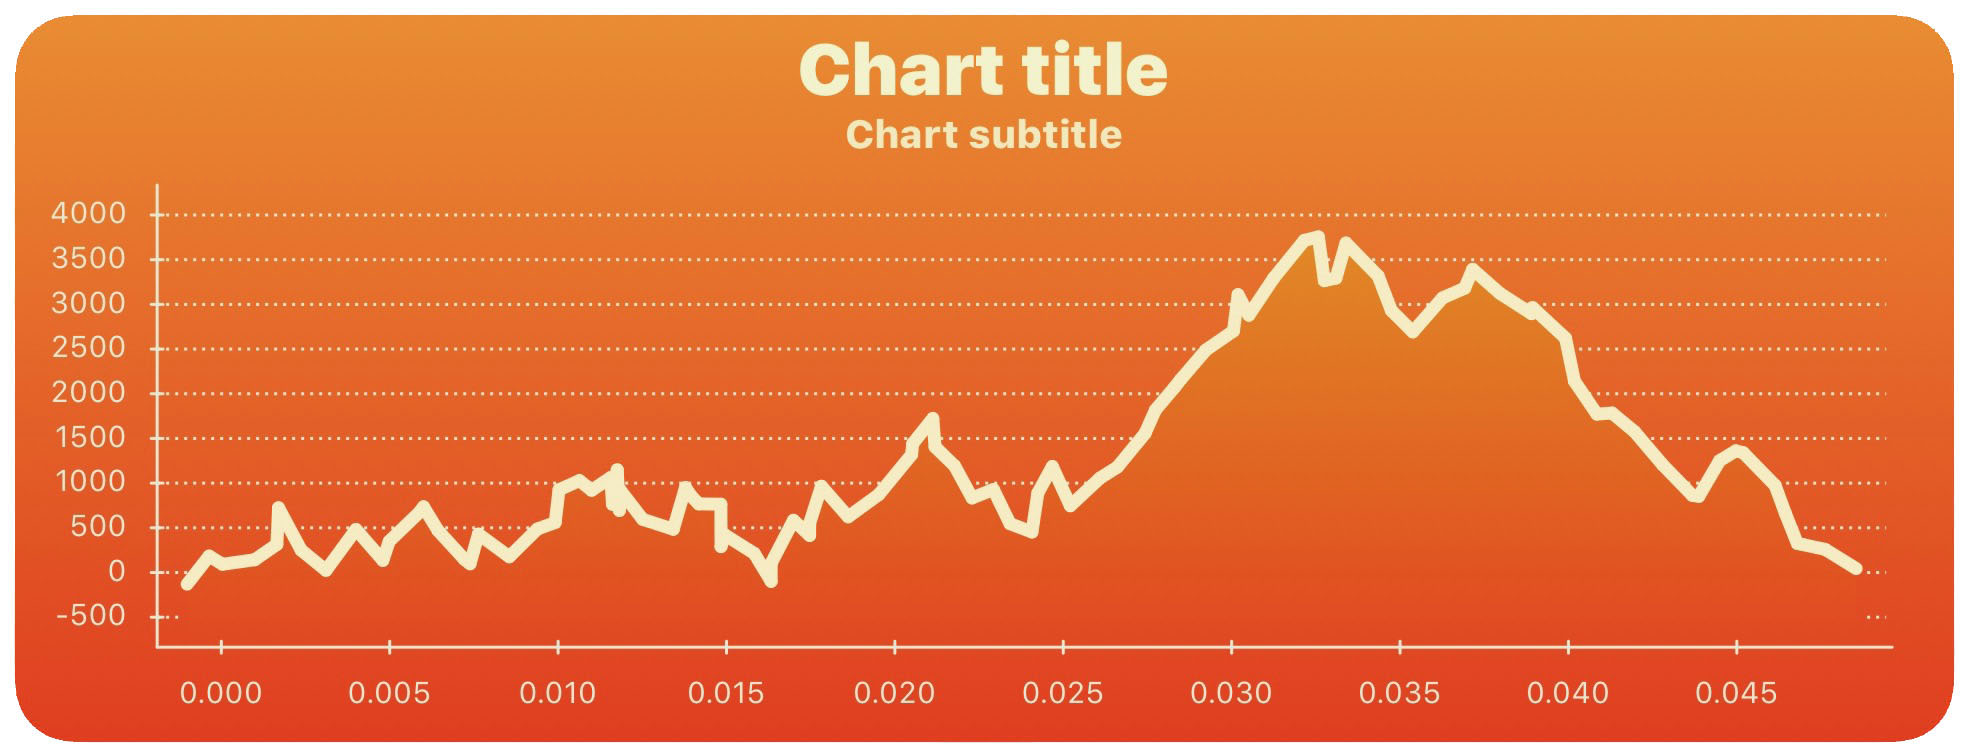
HCLineChartView 是一个漂亮的 iOS 库,使创建和自定义折线图既快速又简单。
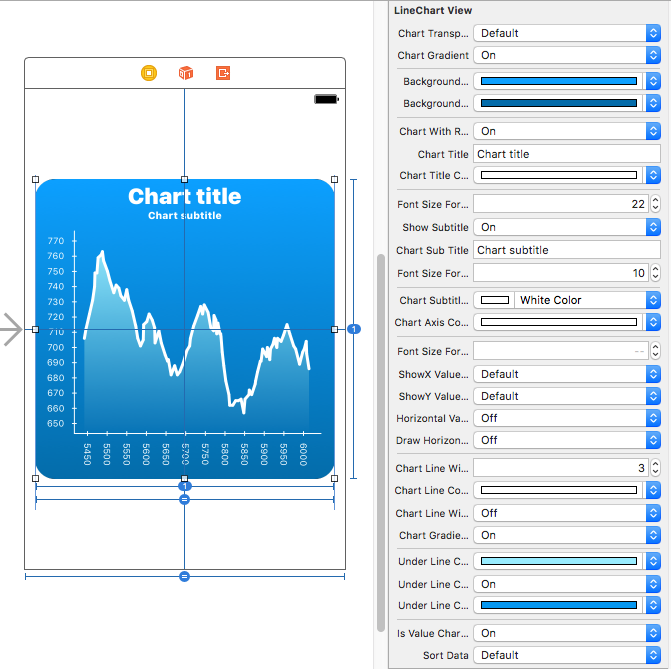
使用此库,您可以完全自定义您的折线图外观。它易于设置和使用在任何 iOS 项目中。它支持从界面构建器直接进行图表设置并具有实时预览。在方向更改时自动重绘将使具有纵向和横向布局的应用程序更轻松。
查看示例应用以获取示例和用法。
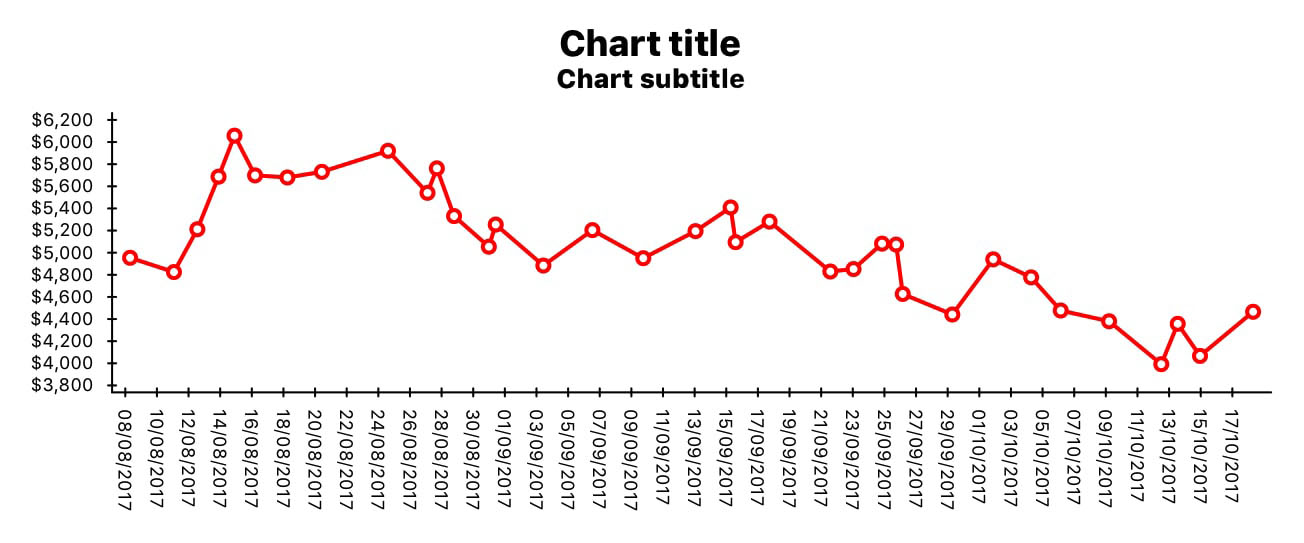
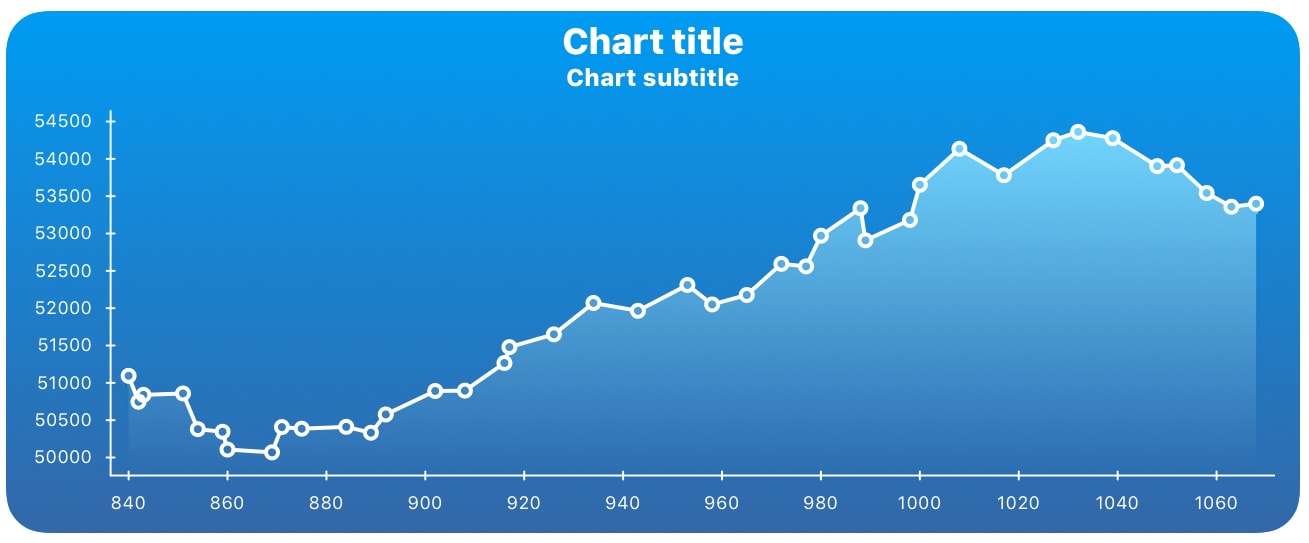
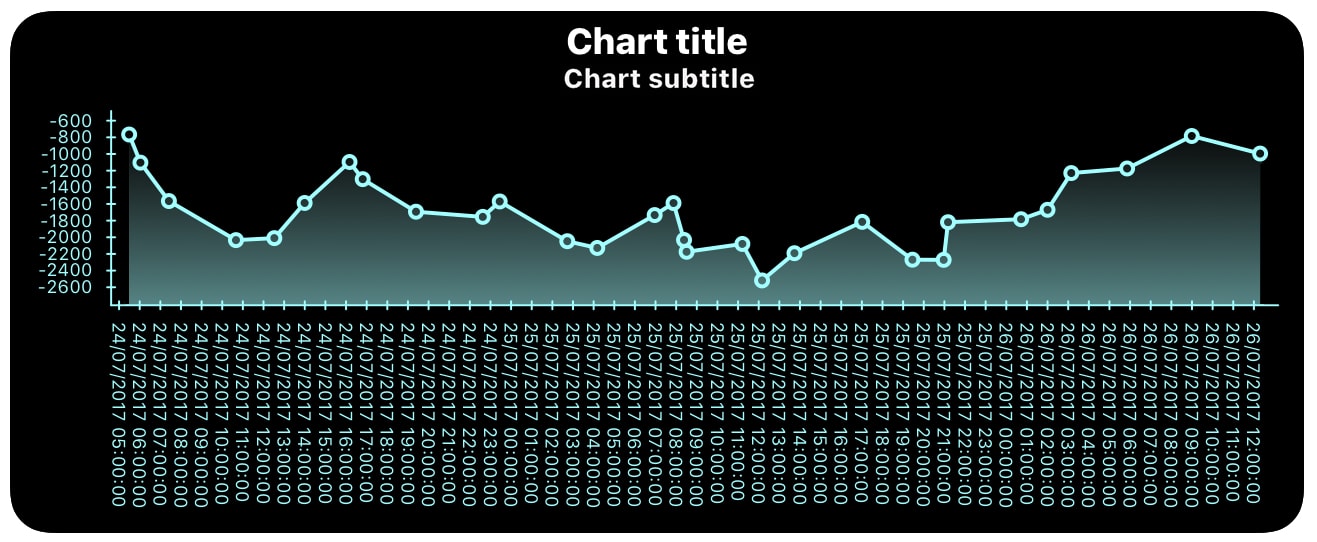
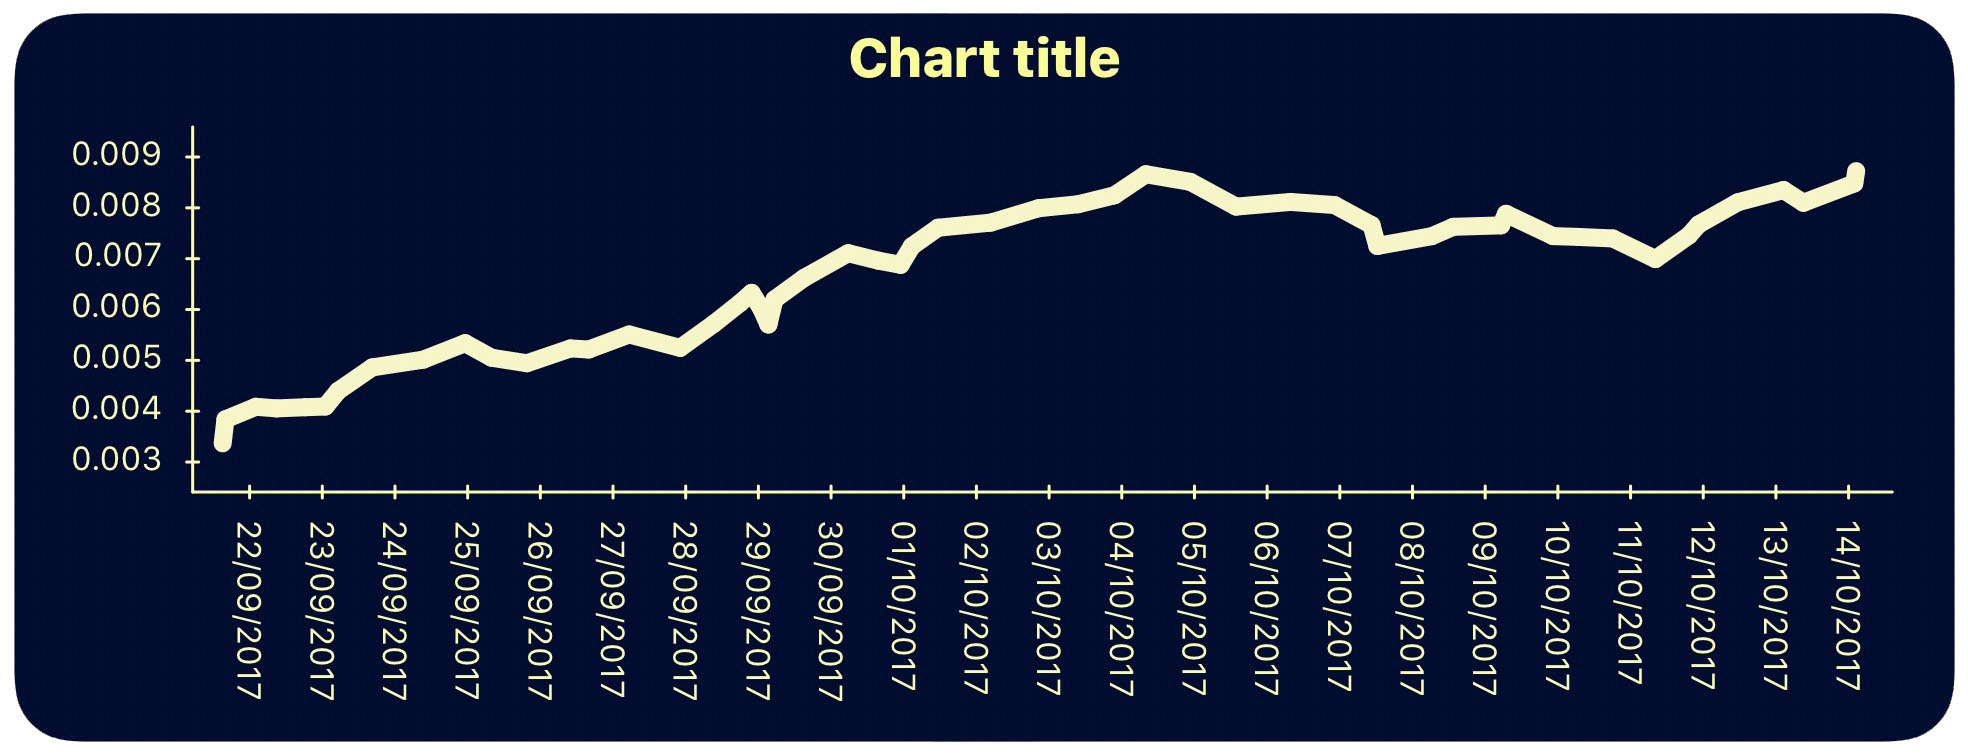
用法示例
HCLineChartView 简化了自定义折线图设置和外观。以下是一些示例
功能
- 易于设置
- 易于自定义线图设置和外观,即直接在界面构建器中设置线图属性(标题、副标题、颜色、渐变、图表线或轴宽、字体大小等)或从代码中设置,并具有实时预览。
- 易于设置或更改图表数据并重新加载图表
- 自动检测 X 轴上的值是数值还是日期/时间值。它还检查 X 轴和 Y 轴上的值是否有效。
- 基于图表数据和图表框架自动计算两个轴上的刻度位置和值。
- 在方向更改事件上自动重绘,没有扭曲。
安装
Podfile
CocoaPods 是 Objective-C 和 Swift 的依赖项管理器,它自动简化了在项目中使用类似于 HCLineChartView 的第三方库的过程。
要将 HCLineChartView 集成到您的 Xcode 项目中,使用 CocoaPods,请在 Podfile 中指定它
target '<TargetName>' do
    use_frameworks!
    pod 'HCLineChartView'
end
然后,运行以下命令
$ pod install
带有源代码
如果您不想使用 CocoaPods 作为依赖项管理器,您可以将 HCLineChartView 手动集成到您的项目中。只需下载存储库并将 Source/HCLineChartView 文件夹包含到您的项目中即可。
用法
-
通过 CocoaPods 或手动将 HCLineChartView 库添加到您的项目中。
注意:HCLineChartView 是用 Objective-C 编写的库,但它也可以使用 桥接头 将其添加到 Swift 项目中。 -
将 HCLineChartView 库包含到需要的地方。如果您使用 Podfile 安装了此库,则使用指令进行包含
#include <HCLineChartView/HCLineChartView.h>
如果您手动将此库添加到您的项目中,则使用以下方式包含它
#import "HCLineChartView.h"
-
在 .storyboard 或 .xib 文件中放置一个 UIView,并将其定义为 HCLineChartView 的类
还要在相应的文件中为此 HCLineChartView 创建出口
@property (strong, nonatomic) IBOutlet HCLineChartView *hcLineChartView;您还可以像任何其他视图一样从代码中添加此视图
HCLineChartView* hcLineChartView = [[HCLineChartView alloc] initWithFrame:CGRectMake(100, 100, 300, 300)];
[self.view addSubview: hcLineChartView];
-
如果您想更改折线图的外观和基本设置,您可以在界面构建器中或在代码中对图表设置进行配置。您不必修改这些参数。在这种情况下,图表将以默认设置绘制。如果您仍然想自定义图表,您可以直接从故事板或xib文件中更改多个属性(标题、副标题、颜色、圆角半径等)。此外,您也可以直接从代码中更改所需属性,如下面的示例所示:
 self.hcLineChartView.chartTitle = @"Revenue over time";
 self.hcLineChartView.chartTitleColor = [UIColor yellowColor];
 self.hcLineChartView.showSubtitle = NO;
 self.hcLineChartView.chartGradient = YES;
 self.hcLineChartView.backgroundGradientTopColor = [UIColor colorWithRed:0.0 green:0.5 blue:0.5 alpha:1.0];
 self.hcLineChartView.backgroundGradientBottomColor = [UIColor colorWithRed:0.0 green:0.3 blue:0.3 alpha:1.0];
 self.hcLineChartView.chartLineColor = [UIColor yellowColor];
 self.hcLineChartView.chartAxisColor = [UIColor yellowColor];
 self.hcLineChartView.chartGradientUnderline = YES;
 self.hcLineChartView.underLineChartGradientTopColor = [UIColor yellowColor];
 self.hcLineChartView.underLineChartGradientBottomColor = [UIColor orangeColor];
您可以用相同的方式设置所有其他参数。
-
设置或更新图表数据
self.hcLineChartView.xElements = [[NSMutableArray alloc] initWithObjects:@(10),@(20),@(25),@(30),@(40),@(45),@(60),@(65),@(70),@(75),@(80),@(85),@(100),@(120),@(125),@(130),@(145),@(150),@(155),@(165),@(175),@(185),@(195),@(200), nil];
self.hcLineChartView.yElements = [[NSMutableArray alloc] initWithObjects:@(210),@(222),@(212),@(216),@(232),@(247),@(262),@(261),@(276),@(274),@(281),@(288),@(290),@(283),@(242),@(250),@(270),@(265),@(260),@(262),@(277),@(272),@(281),@(289), nil];
如果您想在X轴上显示时间,应该在xElements数组中填充NSDate实例,例如以下示例:
self.hcLineChartView.xElements = [[NSMutableArray alloc] initWithObjects:
                                     [NSDate dateWithTimeIntervalSince1970:1504785810],
                                     [NSDate dateWithTimeIntervalSince1970:1504795873],
                                     [NSDate dateWithTimeIntervalSince1970:1504805270],
                                     [NSDate dateWithTimeIntervalSince1970:1504815840],
                                     [NSDate dateWithTimeIntervalSince1970:1504825810],
                                     [NSDate dateWithTimeIntervalSince1970:1504835873],
                                     [NSDate dateWithTimeIntervalSince1970:1504845270],
                                     [NSDate dateWithTimeIntervalSince1970:1504855840], NULL];
-
绘制/重绘图表。
在更改属性或更新图表数据后,您必须重新绘制图表[self.hcLineChartView drawChart];
此外,如果您想更新图表数据并重新绘制图表,您可以使用updateChartWithData方法
 NSMutableArray* xElements = [[NSMutableArray alloc] initWithObjects:@(10),@(20),@(25),@(30),@(40),@(45),@(60),@(65),@(70),@(75),@(80),@(85),@(100),@(120),@(125),@(130),@(145),@(150),@(155),@(165),@(175),@(185),@(195),@(200), nil];
 NSMutableArray* yElements = [[NSMutableArray alloc] initWithObjects:@(210),@(222),@(212),@(216),@(232),@(247),@(262),@(261),@(276),@(274),@(281),@(288),@(290),@(283),@(242),@(250),@(270),@(265),@(260),@(262),@(277),@(272),@(281),@(289), nil];
 [self.hcLineChartView updateChartWithXElements:xElements yElements:yElements];
在任何情况下,您可以从这个仓库下载并运行HCLineChartView Sample项目。在这个项目中,有一个使用示例,您可以从中了解如何使用这个库。
HCLineChartView基本参数和方法的简要预览
为了更好地理解如何使用这些参数和方法,以下是对基本HCLineChartView属性和方法简短的概述,您可以使用这些属性来设置图表。
HCLineChartView基本属性
图表背景设置
/// This property defines if chart background is transparent or not.
@property IBInspectable BOOL chartTransparentBackground;

/// This property defines if chart background has the gradient.
@property IBInspectable BOOL chartGradient;

/// This property defines the top color for background gradient. It is also the background color for the chart if chartGradient is set to NO.
@property (retain, nonatomic) IBInspectable UIColor* backgroundGradientTopColor;

/// This property defines the bottom color for background gradient.
@property (retain, nonatomic) IBInspectable UIColor* backgroundGradientBottomColor;

/// This property defines if chart view should have rounded corners.
@property IBInspectable BOOL chartWithRoundedCorners;
标题和副标题设置
@property (retain, nonatomic) IBInspectable NSString* chartTitle;

/// This property defines chart title color.
@property (retain, nonatomic) IBInspectable UIColor* chartTitleColor;

/// This property defines font size for chart title.
@property IBInspectable double fontSizeForTitle;

/// This property defines if the chart has a subtitle.
@property IBInspectable BOOL showSubtitle;

/// This property defines chart subtitle.
@property (retain, nonatomic) IBInspectable NSString* chartSubTitle;

/// This property defines font size for chart subtitle.
@property IBInspectable double fontSizeForSubTitle;

/// This property defines chart subtitle color.
@property (retain, nonatomic) IBInspectable UIColor* chartSubtitleColor;
图表轴设置
/// This property defines chart axes color.
@property (retain, nonatomic) IBInspectable UIColor* chartAxisColor;

/// This property defines font size for chart axes.
@property IBInspectable double fontSizeForAxis;

/// This property defines if values on the X axis should be in currency format. It is useful in cases where we need to show exchange rate on chart
@property IBInspectable BOOL showXValueAsCurrency;

/// TThis property defines currency code for the X axis. It is relevant if showXValueAsCurrency parameter is set to YES. If you don't define currency code or currency code is not valid, the chart will display your local currency code.
@property (retain, nonatomic) IBInspectable NSString* xAxisCurrencyCode;

/// This property defines if values on the Y axis should be in currency format. It is useful when we need to show exchange rate on the chart (if showXValueAsCurrency is also set to YES), or in any other case where we need to show Y values in currency format (price, saving, debt, surplus, deficit,...)
@property IBInspectable BOOL showYValueAsCurrency;

/// This property defines currency code for the Y axis. It is relevant if showYValueAsCurrency parameter is set to YES. If you don't define currency code or currency code is not valid, the chart will display your local currency code.
@property (retain, nonatomic) IBInspectable NSString* yAxisCurrencyCode;

/// This property defines if values on X axis should be presented horizontally (vertically is default).
@property IBInspectable BOOL horizontalValuesOnXAxis;

/// This property defines if values on this axis should have horizontal orientation (default orientation is vertical)
@property IBInspectable BOOL drawHorizontalLinesForYTicks;
HCLineChartView设置
/// This property defines chart line width.
@property IBInspectable float chartLineWidth;

/// This property defines chart line color.
@property (retain, nonatomic) IBInspectable UIColor* chartLineColor;

/// This property defines if chart points should have circles
@property IBInspectable BOOL chartLineWithCircles;

/// This property defines if the area under chart line should have gradient
@property IBInspectable BOOL chartGradientUnderline;

/// This property defines if bottom gradient color for the area under chart line is transparent.
@property (retain, nonatomic) IBInspectable UIColor* underLineChartGradientTopColor;

/// This property defines if bottom gradient color for the area under chart line is transparent.
@property IBInspectable BOOL underLineChartGradientBottomColorIsTransparent;

/// This property defines bottom gradient color for the area under chart line. This parameter is valid only if chart itself isn't transparent
@property (retain, nonatomic) IBInspectable UIColor* underLineChartGradientBottomColor;

/// This property defines if the distribution of values on X axis should be value based.
@property IBInspectable BOOL isValueChartWithRealXAxisDistribution;
HCLineChartView数据
/// It is recommended to provide already sorted data before drawing the chart. If you don't have values for X axis sorted ascending, you can set this parameter to YES. In that case, provided values for X axis (xElements) will be sorted ascending, with the parallel sorting of paired values for Y axis (yElements). Sorting data could have a small impact on chart drawing performance.
@property IBInspectable BOOL sortData;

/// Array for storing values for the X axis. Only NSNumber and NSDate values are allowed.
@property (retain, nonatomic) NSMutableArray* xElements;

/// Array for storing values for the Y axis. Only NSNumber values are allowed.
@property (retain, nonatomic) NSMutableArray* yElements;
通过更改这些数组,您实际上是在更改图表的数据率。
HCLineChartView方法
绘制和更新方法
/// Draws/redraws chart with current data and settings.
-(void)drawChart;

/// Updates chart with new data
/// @param xElements Values for X axis.
/// @param yElements Values for Y axis.
-(void)updateChartWithXElements:(NSArray*)xElements yElements:(NSArray*)yElements;
说明
- 参数应该有合理的值。例如,只有当您有一小部分数据时,才应该将chartWithCircles参数设置为YES。如果您有大量数据,这些圆圈将重叠。同样,chartLineWidth也不应过大。对其他参数也是如此。
- 很明显,一些属性会关闭其他属性。例如,如果showSubtitle设置为NO,则无论您将什么文本设置为chartSubTitle,副标题都会被隐藏。例如,如果您设置了透明背景,即使您设置了,您也无法看到背景渐变。
- 对于X轴,只允许使用NSNumber或NSDate值,对于Y轴,只允许使用NSNumber值。
- 提供的X轴值应按升序排列。如果它们不是或您想确保它们是升序排列的,您应将sortData参数设置为YES。
- 您应该为HCLineChartView设置更大的框架,即足够大以绘制图表线、两个轴和其他元素。最小框架取决于图表设置(字体大小、图表数据、X轴值的方向(水平或垂直)等)。
如果您发现任何错误,请报告,我们将尽快修复它。此外,任何建议都受欢迎。
鸣谢
HCLineChartView 是由 Hypercube 拥有和维护的。